Understanding Your Property Report
Property Map
Property map displays location of the property on the map. Map Layers toggle in the upper right corner of the map enables Satellite, Flood and Tax Parcel layers. Please note, that Tax Parcel layer is only accessible when zoom level is close enough to recognize parcels on the map. In other words, you may need to zoom closer to enable the Tax Parcel layer. Tax maps may not be available in some areas.
Property Information
The property information section provides all the available property details and characteristics including but not limited to:
- legal description
- ownership information
- building
- interior
- land
- utilities
- flood

Property detail coverage may vary from area to area and property type.
External Improvements
This section lists external permanent additions to the primary structure that impact property’s value.

Telephone Numbers
A list of publicly registered telephone numbers at the property.
Taxes and Assessment
List of annual property taxes, tax assessed values and tax exemptions as determined by assessor’s office, typically at the county level.
Sales History
This section includes historic sales information obtained through public records of municipal recorders offices. Sales data may include sale date, recorded date, buyer and seller names, sale price and document ID.
Potential flips and distressed sales are highlighted in yellow and green.
Potential flips are defined by ATTOM Data solutions as a property selling more than once in a one year period.
Potential distressed sales are defined by ATTOM Data Solutions as properties that sold as a result of an auction, or through some other foreclosure related circumstance.

Active Mortgages and Equity Analysis
This section displays the current Active Mortgage on the property with all available mortgage information, while also providing a breakdown of the available equity on the property. Property Navigator estimates the total debt based on the amortized balance and subtracts that from the property's AVM (estimated value) to calculate the available equity and loan to value ratio. By hovering over the different colors of the pie chart, you can see the breakdown of equity vs. debt on the property.
 To display the full Mortgage Property, click the link labeled "View Full Mortgage History" for all available historical mortgages on the property. Mortgages highlighted in orange indicate they occurred prior to the most recent sale of the property

Foreclosure Activity
Foreclosure Activity identifies all available pre-foreclosure notices that have been filed for the property. Any pre-foreclosure notice highlighted in orange indicates the filing occurred prior to the most recent sale of the property. Pre-foreclosure notices include Notice of Default (NOD), Lis Pendens (LIS), Notice of Trustee Sale (NTS), and Notice of Foreclosure Sale (NFS).

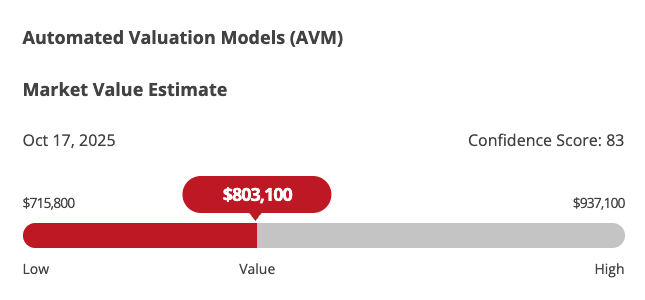
Automated Valuation Model
An Automated Valuation Model (AVM) is a computer-generated estimate of the likely sale value of a property under current market conditions. ATTOM Data employs multiple valuation models to choose the modeling approach that is most accurate for the geographic area surrounding the individual property.
Every property receives a unique confidence score ranging from 0 to 100, representing how reliable the AVM estimate is for that specific property. This confidence score is calculated as 100 minus the Forecast Standard Deviation (FSD), which is the expected percentage deviation between our estimate and the likely sale price. For example, a property with an FSD of 12% receives a confidence score of 88, meaning we expect 68% of similar properties to sell within 12% of our estimated value. Our confidence scores are property-specific and calibrated to actual market performance through machine learning models trained on millions of historical transactions. This ensures that when we indicate a particular confidence level, that level of accuracy is consistently achieved relative to real-world sales.


 To display the full Mortgage Property, click the link labeled "View Full Mortgage History" for all available historical mortgages on the property. Mortgages highlighted in orange indicate they occurred prior to the most recent sale of the property

